
We put a real app on Kubernetes in AWS. Here is every single step.
This is the complete story of taking a small web application from a laptop to the public internet, running on Amazon’s managed Kubernetes service. Nothing is skipped. Every command, every thing that broke, and — most importantly — why each piece exists and how the pieces find each other.
First, the whole thing in plain words
Imagine you have written a story (your app) and you want people all over the world to read it.
- You need to print copies of the story. That is Docker: it packs your app into a sealed box that works the same everywhere.
- You need a warehouse to keep the printed copies. That is ECR, Amazon’s private box storage.
- You need shelves in a shop where copies get unpacked and read. That is Kubernetes: it takes boxes out of the warehouse and runs them on computers.
- You need a front door with a doorman so visitors reach the right shelf. That is the load balancer.
- You need a filing cabinet that remembers things after the shop closes. That is the database.
- You need a notepad by the till for things you look up constantly, so you do not walk to the filing cabinet every time. That is Redis, the cache.
- And you want the shop to restock itself whenever you write a new page. That is GitHub Actions, the robot assistant.
Everything below is just those seven ideas, spelled out properly.
The app we are deploying
A deliberately small thing, chosen because it exercises every layer:
- Frontend — React 19 + TypeScript, built with Vite, served by nginx
- Backend — Laravel 13 on PHP 8.4, nginx + php-fpm in one container
- Database — MySQL 8.0
- Cache — Redis 7
It is a message board. You type a message, it saves. The interesting part is that the page shows you where its data came from — a badge says whether an answer was served from MySQL or from the Redis cache. That makes the plumbing visible, which is the whole point of the exercise.
Here it is running on AWS, served through the load balancer:
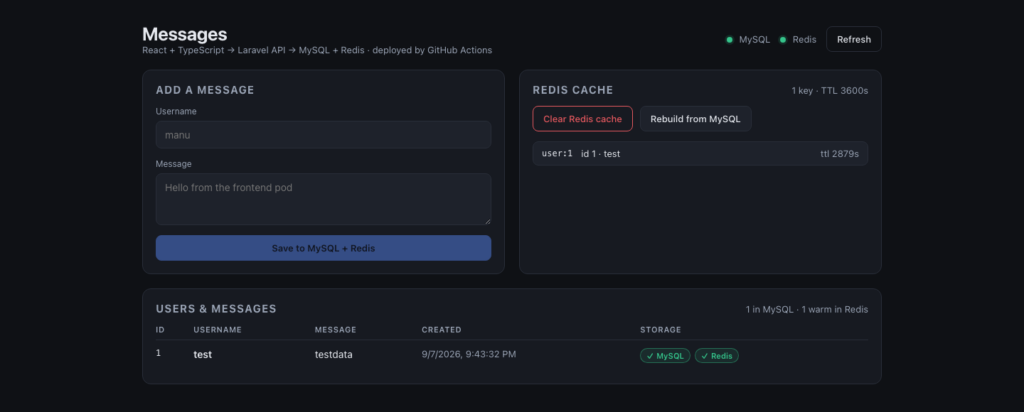

Look at what that screenshot tells you. The two dots top right are the live /api/health response — the backend pod can reach both MySQL and Redis right now. The row at the bottom carries two badges, so that message is in the database and warm in the cache. The panel on the right lists the actual Redis key with its remaining time to live. The subtitle says “deployed by GitHub Actions” because that text only exists in the image the pipeline built.
The API is five endpoints:
| Method | Path | Does |
|---|---|---|
| GET | /api/health | reports whether MySQL and Redis are reachable |
| GET | /api/messages | list messages (cached) |
| POST | /api/messages | save a message |
| GET | /api/cache | show what is currently cached |
| DELETE | /api/cache | empty the cache |
How a request actually travels
This is the part most tutorials leave vague. Follow one click from a browser all the way down and back.
                        your browser
                             │
                             │  1. DNS: what IP is aws-app-alb-xxxx.elb.amazonaws.com?
                             ▼
                    ┌────────────────────┐
                    │  Application Load  │  2. public, listening on port 80
                    │  Balancer (ALB)    │
                    └─────────┬──────────┘
                              │  3. forwards to a healthy pod IP
                              ▼
                    ┌────────────────────┐
                    │  frontend pod ×2   │  nginx on :8080
                    │  React bundle      │  serves index.html + JS
                    └─────────┬──────────┘
                              │  4. anything starting /api/ is proxied onward
                              │     to http://backend.aws-app.svc.cluster.local:8000
                              ▼
                    ┌────────────────────┐
                    │  backend pod ×2    │  nginx + php-fpm on :8000
                    │  Laravel 13        │
                    └────┬──────────┬────┘
                         │          │
              5. cache   │          │  6. durable storage
                         ▼          ▼
                 ┌────────────┐  ┌──────────────────┐
                 │ redis pod  │  │ RDS MySQL        │
                 │ :6379      │  │ private subnets  │
                 └────────────┘  └──────────────────┘
Six hops. Each one is worth understanding:
1. DNS. The load balancer gets a name from AWS, something like aws-app-alb-404476546.ap-southeast-2.elb.amazonaws.com. When a browser asks for that name, AWS answers with the current IP addresses. There can be several, and they change — which is why you never hardcode an IP.
2. The ALB is the only thing on the public internet. It has a public address. Nothing else in this entire system does. Not the pods, not the database.
3. The ALB forwards to a pod. It keeps a list of healthy pod IP addresses (the “target group”) and sends each request to one of them. If a pod stops answering its health check, the ALB stops sending it traffic within seconds.
4. The frontend proxies the API. This is a design decision worth explaining. The React bundle is just files — HTML, JavaScript, CSS. When the JavaScript wants to call the API, it calls /api/messages on the same hostname the user is already on. nginx inside the frontend pod catches anything starting with /api/ and forwards it to the backend.
Two problems disappear because of this:
- No CORS. The browser only ever talks to one origin, so there is no cross-origin request to configure, debug, or get wrong.
- No baked-in API URL. The backend address is supplied at container start through an environment variable, so the exact same image runs on a laptop and in AWS with no rebuild.
Here is the nginx rule that does it:
location /api/ {
    proxy_pass ${BACKEND_URL}/api/;
    proxy_set_header Host              $host;
    proxy_set_header X-Real-IP         $remote_addr;
    proxy_set_header X-Forwarded-For   $proxy_add_x_forwarded_for;
    proxy_set_header X-Forwarded-Proto $scheme;
}
${BACKEND_URL} is substituted when the container starts, by this entrypoint:
#!/bin/sh
set -e
: "${BACKEND_URL:=http://backend:8000}"
export BACKEND_URL

# Only BACKEND_URL is substituted; nginx's own $variables must survive intact.
envsubst '${BACKEND_URL}' \
    < /etc/nginx/templates/nginx.conf.template \
    > /etc/nginx/conf.d/default.conf

exec "$@"
Note the single-quoted argument to envsubst. Without it, envsubst would also replace nginx’s own variables like $host and $remote_addr with empty strings, and the proxy headers would silently break.
5 and 6. Backend to Redis and MySQL. The backend reaches Redis at the hostname redis and MySQL at its RDS endpoint. How does the name redis resolve to anything? That is Kubernetes DNS, and it deserves its own section.
How the pieces find each other: Kubernetes Services
A pod is disposable. It can be deleted and recreated on a different machine with a different IP address at any moment. So nothing addresses a pod directly.
Instead, every group of pods gets a Service — a stable name and a stable virtual IP that always points at whichever pods are currently alive and healthy.
We create three:
| Service | Port | Who calls it |
|---|---|---|
frontend | 80 | the ALB |
backend | 8000 | the frontend’s nginx |
redis | 6379 | the backend |
Inside the cluster, every Service gets a DNS name of the form <service>.<namespace>.svc.cluster.local. So the frontend’s nginx is pointed at:
http://backend.aws-app.svc.cluster.local:8000You can shorten that to just backend when you are in the same namespace, which is why the local Docker Compose setup and the Kubernetes setup can share config.
The database is the exception. RDS is not a Kubernetes object, so it has an AWS hostname instead, and that hostname goes into a Secret.
The cast, in plain English
Before the steps, here is every proper noun you are about to meet.
| Thing | What it really is |
|---|---|
| Docker image | a sealed box containing your app and everything it needs to run |
| ECR | Amazon’s private warehouse for those boxes |
| Kubernetes | software that runs boxes on a fleet of computers and restarts them when they die |
| EKS | Kubernetes, operated by Amazon so you do not have to |
| Control plane | Kubernetes’ brain. Amazon runs it. You pay hourly for it |
| Node | an ordinary EC2 virtual machine that actually runs your containers |
| Pod | one running copy of your app. The smallest thing Kubernetes manages |
| Deployment | “keep 2 copies of this pod alive at all times, and roll out new versions safely” |
| Service | a stable name and IP for a group of pods |
| Ingress | “please give me a load balancer, pointed at this Service” |
| Namespace | a folder inside the cluster, for keeping things separate |
| ConfigMap | non-secret settings, injected as environment variables |
| Secret | the same, but for passwords. Stored separately, never in git |
| Job | run this once until it succeeds, then stop. Used for database migrations |
| ALB | Amazon’s Application Load Balancer. The public front door |
| VPC | your own private network inside AWS |
| Subnet | a slice of that network. Public ones can reach the internet directly, private ones cannot |
| NAT gateway | lets private machines make outbound calls without being reachable inbound |
| Security group | a firewall attached to a resource |
| RDS | a MySQL database that Amazon patches, backs up and monitors for you |
| IAM | who is allowed to do what in AWS |
| IAM role | a set of permissions something can temporarily borrow |
| OIDC | a way to prove identity without a password. Central to the CI setup |
The shape of the work
Eight stages, bottom-up. Roughly two hours of wall-clock time, most of it waiting for AWS to build things.
| Stage | What gets built | Time | Cost while running |
|---|---|---|---|
| 0 | CLI tools, credentials, one settings file | 10 min | $0 |
| 1 | Two image repositories, first manual push | 10 min | ~$0.10/mo |
| 2 | VPC, EKS control plane, 2 worker nodes | 20 min | ~$166/mo |
| 3 | Private MySQL inside the cluster’s network | 15 min | ~$15/mo |
| 4 | The controller that creates load balancers | 10 min | free |
| 5 | The app, deployed by hand | 15 min | ~$16/mo |
| 6 | Automated deploys from GitHub | 20 min | $0 |
| 7 | Verify, operate, tear down | 10 min | — |
Total ≈ $197/month, about $0.27/hour.
Why this order, and why Stage 5 is manual
You cannot deploy without a registry. You cannot use a registry without a cluster. You cannot expose a cluster without a load balancer. The dependencies force the sequence.
Stage 5 deploys the app by hand on purpose, and Stage 6 then automates exactly those same steps. This matters more than it sounds: when the pipeline eventually goes red, you already know which manual command each step corresponds to. Automating first just hides the failure behind a CI log you do not yet understand.
Stage 0 — Tools and credentials
In plain words: before building anything, get your tools out and prove the shop actually belongs to you.
Four command-line tools:
brew install awscli eksctl kubectl helmawstalks to Amazon.eksctlcreates Kubernetes clusters. It is a friendly wrapper over CloudFormation, Amazon’s “build all this infrastructure” service.kubectltalks to Kubernetes.helminstalls pre-packaged Kubernetes software.
Verify all four:
aws --version && eksctl version && kubectl version --client && helm version --shortCredentials
aws configureIt asks for an access key, a secret key, a region and an output format. Then prove it works:
aws sts get-caller-identityThat prints your account id, user id and ARN. An ARN — Amazon Resource Name — is just a globally unique address for a thing in AWS. You will see hundreds.
The permissions trap
“Admin-ish permissions” is not a figure of speech. Across these stages your identity calls ecr, eks, ec2, cloudformation, iam, rds, elasticloadbalancing, autoscaling and ssm. eksctl alone creates IAM roles and a CloudFormation stack on your behalf.
We found this out the hard way at Stage 1, with:
AccessDeniedException ... User: arn:aws:iam::111122223333:user/eks-lab-admin
is not authorized to perform: ecr:CreateRepository
See what your user actually has:
aws iam list-attached-user-policies --user-name <your-iam-user>
aws iam list-user-policies          --user-name <your-iam-user>
For a throwaway lab, attach admin for the duration and remove it at teardown:
aws iam attach-user-policy \
  --user-name <your-iam-user> \
  --policy-arn arn:aws:iam::aws:policy/AdministratorAccess
If that call is also denied, the user cannot grant itself rights. Do it once in the web console signed in as the account root: IAM → Users → your user → Add permissions → Attach policies directly → AdministratorAccess. New permissions take effect on the very next call; there is no need to rotate keys.
Prefer something narrower? These managed policies together cover every stage:
for p in AmazonEC2ContainerRegistryFullAccess \
         AmazonEC2FullAccess \
         AWSCloudFormationFullAccess \
         AmazonRDSFullAccess \
         IAMFullAccess \
         AmazonEKSClusterPolicy; do
  aws iam attach-user-policy --user-name <your-iam-user> \
    --policy-arn "arn:aws:iam::aws:policy/$p"
done
EKS write access has no managed policy, so add it inline:
aws iam put-user-policy --user-name <your-iam-user> \
  --policy-name EksLabClusterAdmin \
  --policy-document '{"Version":"2012-10-17","Statement":[{"Effect":"Allow","Action":"eks:*","Resource":"*"},{"Effect":"Allow","Action":"ssm:GetParameter","Resource":"*"}]}'
One settings file
Every stage reads the same file, so each value is written exactly once.
cp deploy/env.sh.example deploy/env.shFill in region, a strong database password (RDS rejects /, @, " and spaces), your GitHub repo, and the Kubernetes version. Then:
source deploy/env.shEvery new terminal window needs source deploy/env.sh again. Environment variables do not survive a new shell. This bit us twice — see the errors section.
If you are on a Mac, fix zsh first
macOS ships zsh with interactive_comments off. Pasting a command with a trailing comment passes those words as arguments:
export IMAGE_TAG=bootstrap    # the tag you pushed
zsh: export: not an identifier: 1
Turn it on once:
echo 'setopt interactive_comments' >> ~/.zshrc
setopt interactive_comments
zsh also does not split unquoted variables into separate words the way bash does. Where a variable holds several values, collect it into an array and quote it as "${VAR[@]}". This causes a genuinely baffling error in Stage 3.
Checkpoint: aws sts get-caller-identity prints your account, and echo $AWS_REGION $CLUSTER_NAME $ECR_REGISTRY prints three non-empty values. If ECR_REGISTRY is empty, your credentials are not working — fix that before going further.
Stage 1 — The image warehouse (ECR)
In plain words: build the sealed boxes, and put them somewhere the shop can collect them from. Your laptop is not that place.
EKS nodes cannot pull images from your laptop. The images have to live in a registry the cluster can reach. ECR is Amazon’s private one, and cluster nodes get pull access automatically through their instance role — no credentials to configure.
Create the repositories
source deploy/env.sh

for repo in "$FRONTEND_REPO" "$BACKEND_REPO"; do
  aws ecr create-repository \
    --repository-name "$repo" \
    --region "$AWS_REGION" \
    --image-scanning-configuration scanOnPush=true \
    --query 'repository.repositoryUri' --output text
done
scanOnPush=true makes ECR check every uploaded image against a database of known vulnerabilities. It is free and there is no reason not to.
Log Docker in
aws ecr get-login-password --region "$AWS_REGION" \
  | docker login --username AWS --password-stdin "$ECR_REGISTRY"
That token lasts 12 hours. When pushes suddenly start failing with denied, this is almost always why.
Build for the right processor
This one catches almost everybody with a modern Mac.
Apple Silicon Macs are arm64. The EKS nodes we are about to create are x86_64. A container built on one will not run on the other — it starts and dies immediately with exec format error, which looks like a corrupt image but is not.
docker build --platform linux/amd64 -t "$ECR_REGISTRY/$BACKEND_REPO:bootstrap"  ./www/backend
docker build --platform linux/amd64 -t "$ECR_REGISTRY/$FRONTEND_REPO:bootstrap" ./www/frontend

docker push "$ECR_REGISTRY/$BACKEND_REPO:bootstrap"
docker push "$ECR_REGISTRY/$FRONTEND_REPO:bootstrap"
The backend build takes a few minutes the first time — it compiles the pdo_mysql and redis PHP extensions from source.
What is inside the boxes
Both images are multi-stage builds: a big toolchain image does the building, then only the finished output is copied into a small runtime image. The build tools never ship to production.
The frontend: node:20-alpine runs npm ci and npm run build, then the resulting dist/ folder is copied into nginx:1.27-alpine. The final image contains no Node.js at all.
The backend: composer:2 installs PHP dependencies, then everything is copied into php:8.4-fpm-alpine with nginx and supervisor added. supervisord runs nginx and php-fpm side by side in one container.
Checkpoint:
aws ecr describe-images --repository-name "$BACKEND_REPO" --region "$AWS_REGION" \
  --query 'imageDetails[].imageTags' --output text
Prints bootstrap. And confirm the architecture really took:
docker image inspect "$ECR_REGISTRY/$BACKEND_REPO:bootstrap" --format '{{.Architecture}}'Must print amd64.
Stage 2 — The cluster
In plain words: rent the shop. One command builds the building, the shelves, the electrical wiring and the front gate.
One eksctl command creates all of this:
| Resource | Why it exists |
|---|---|
| VPC | your own private network |
| 2 public + 2 private subnets | across two availability zones, for redundancy |
| NAT gateway | private nodes need outbound internet to pull images |
| EKS control plane | the managed Kubernetes brain |
| Managed node group (2 × t3.medium) | the machines your pods actually run on |
| OIDC provider | lets pods borrow IAM roles without access keys |
Public versus private subnets
An availability zone is a physically separate datacentre. Two of them means one can catch fire and you stay up.
A public subnet has a route to the internet gateway — machines there can be reached from outside. A private subnet does not. Our worker nodes live in private subnets, so nothing on the internet can reach them directly, ever.
But those nodes still need to download things — container images, security updates. That is the NAT gateway: it sits in a public subnet and makes outbound calls on behalf of private machines, while allowing nothing inbound. Think of a hotel concierge who will post your letters but will not let strangers into your room.
That NAT gateway costs about $33/month and cannot be switched off while the cluster exists. It is the second-largest line on the bill.
Pick a Kubernetes version that is still in standard support
Do not skip this. It cost us real money.
Every EKS Kubernetes version gets roughly 14 months of standard support, then rolls automatically into extended support. Nothing breaks. The cluster looks identical in every console and every CLI output. But the control plane price goes from $0.10/hour to $0.60/hour — six times more, billed as a separate invoice line called “Amazon EKS extended support”.
We created the cluster on 1.31 without checking, and found out from the bill:
Amazon Elastic Container Service for Kubernetes ExtendedSupport
USD 8.17 — 16.332 Hours
That is exactly $0.50/hour of pure surcharge. $360/month, for nothing.
List what is currently supported before creating anything:
aws eks describe-cluster-versions --region "$AWS_REGION" \
  --query 'clusterVersions[].[clusterVersion,versionStatus]' --output table
------------------------------
| DescribeClusterVersions |
+-------+--------------------+
| 1.36 | STANDARD_SUPPORT |
| 1.35 | STANDARD_SUPPORT |
| 1.34 | STANDARD_SUPPORT |
| 1.33 | EXTENDED_SUPPORT |
| 1.32 | EXTENDED_SUPPORT |
| 1.31 | EXTENDED_SUPPORT |
+-------+--------------------+Pick the newest STANDARD_SUPPORT row. Put it in deploy/env.sh as K8S_VERSION and never hardcode it in a template.
To check a cluster you already have:
aws eks describe-cluster --name "$CLUSTER_NAME" --region "$AWS_REGION" \
  --query 'cluster.version' --output text
Upgrading is possible — eksctl upgrade cluster --version <next> --approve — but it moves one minor version at a time, about 25 minutes per hop, and the intermediate versions may also be in extended support. Three hops to escape is common. For a short-lived lab it is cheaper to finish and tear down.
The cluster definition
apiVersion: eksctl.io/v1alpha5
kind: ClusterConfig

metadata:
  name: ${CLUSTER_NAME}
  region: ${AWS_REGION}
  version: "${K8S_VERSION}"

# Required so the ALB controller and any IRSA service account can get an IAM role.
iam:
  withOIDC: true

vpc:
  nat:
    gateway: Single   # one NAT gateway instead of one per AZ -- ~$32/mo cheaper

managedNodeGroups:
  - name: ng-default
    instanceType: t3.medium
    desiredCapacity: 2
    minSize: 2
    maxSize: 4
    volumeSize: 20
    privateNetworking: true
    labels:
      role: worker

cloudWatch:
  clusterLogging:
    enableTypes: ["api", "audit", "authenticator"]
Render it and create:
source deploy/env.sh
envsubst < deploy/cluster.yaml.example > deploy/cluster.yaml
cat deploy/cluster.yaml
eksctl create cluster -f deploy/cluster.yamlThis runs for 15–25 minutes and streams CloudFormation progress. Leave it alone. If it fails partway, clean up before retrying — a half-built stack blocks a rerun:
eksctl delete cluster --name "$CLUSTER_NAME" --region "$AWS_REGION"Point kubectl at it
aws eks update-kubeconfig --name "$CLUSTER_NAME" --region "$AWS_REGION"This writes an entry into ~/.kube/config so kubectl knows which cluster to talk to and how to authenticate.
Checkpoint:
kubectl get nodesNAME STATUS ROLES AGE VERSION
ip-192-168-140-99.ap-southeast-2.compute.internal Ready <none> 7m6s v1.31.14-eks-cb19647
ip-192-168-184-74.ap-southeast-2.compute.internal Ready <none> 7m6s v1.31.14-eks-cb19647Also check the system pods are all Running:
kubectl get pods -AYou want coredns (cluster DNS), aws-node (pod networking) and kube-proxy (service routing) on every node.
From this moment the meter is running. A cluster left up over a weekend costs real money.
Stage 3 — The database
In plain words: install the filing cabinet in a locked back room, with a single door that only shop staff can open.
The database must be in the same VPC as the cluster, in the private subnets, behind a firewall that only accepts connections from the cluster. That is three objects before the database itself.
Find the cluster’s network
source deploy/env.sh

export VPC_ID=$(aws eks describe-cluster --name "$CLUSTER_NAME" --region "$AWS_REGION" \
  --query 'cluster.resourcesVpcConfig.vpcId' --output text)

export CLUSTER_SG=$(aws eks describe-cluster --name "$CLUSTER_NAME" --region "$AWS_REGION" \
  --query 'cluster.resourcesVpcConfig.clusterSecurityGroupId' --output text)
Now the private subnets. eksctl tags them with kubernetes.io/role/internal-elb, so we can find them by tag:
PRIVATE_SUBNETS=($(aws ec2 describe-subnets --region "$AWS_REGION" \
  --filters "Name=vpc-id,Values=$VPC_ID" \
            "Name=tag:kubernetes.io/role/internal-elb,Values=1" \
  --query 'Subnets[].SubnetId' --output text))

echo "SUBNETS=${PRIVATE_SUBNETS[*]}"
Note the surrounding ( ). That makes it a shell array. This is not cosmetic — see the errors section for the 20 minutes it cost us.
RDS needs at least two subnets in different availability zones, even for a single-instance database. Verify:
aws ec2 describe-subnets --region "$AWS_REGION" \
  --subnet-ids "${PRIVATE_SUBNETS[@]}" \
  --query 'Subnets[].[SubnetId,AvailabilityZone]' --output table
Two rows, two different zones.
Subnet group, firewall, rule
aws rds create-db-subnet-group \
  --db-subnet-group-name aws-app-db-subnets \
  --db-subnet-group-description "private subnets for aws_app" \
  --subnet-ids "${PRIVATE_SUBNETS[@]}" \
  --region "$AWS_REGION"
export RDS_SG=$(aws ec2 create-security-group \
--group-name aws-app-rds-sg \
--description "MySQL access from the EKS cluster only" \
--vpc-id "$VPC_ID" --region "$AWS_REGION" \
--query 'GroupId' --output text)aws ec2 authorize-security-group-ingress \
--group-id "$RDS_SG" \
--protocol tcp --port 3306 \
--source-group "$CLUSTER_SG" \
--region "$AWS_REGION"That last command is the interesting one. The rule says “allow port 3306 from this security group“, not “from this range of IP addresses”. Pod IPs come and go constantly; the security group does not. Any machine in the cluster is allowed; nothing else is, regardless of how the network is reconfigured later.
Create the database
aws rds create-db-instance \
  --db-instance-identifier "$RDS_ID" \
  --db-instance-class db.t4g.micro \
  --engine mysql \
  --engine-version 8.0 \
  --allocated-storage 20 \
  --storage-type gp3 \
  --master-username "$RDS_USER" \
  --master-user-password "$RDS_PASSWORD" \
  --db-name "$RDS_DB_NAME" \
  --db-subnet-group-name aws-app-db-subnets \
  --vpc-security-group-ids "$RDS_SG" \
  --no-publicly-accessible \
  --backup-retention-period 1 \
  --no-multi-az \
  --region "$AWS_REGION"
--no-publicly-accessible is the flag that matters most. The database gets no public IP address at all, so it is unreachable from the internet no matter what anyone later does to the firewall rules.
Wait, then keep the endpoint
aws rds wait db-instance-available \
  --db-instance-identifier "$RDS_ID" --region "$AWS_REGION"

export RDS_ENDPOINT=$(aws rds describe-db-instances \
  --db-instance-identifier "$RDS_ID" --region "$AWS_REGION" \
  --query 'DBInstances[0].Endpoint.Address' --output text)

echo "RDS endpoint: $RDS_ENDPOINT"
aws rds wait blocks until the database is ready — usually about 10 minutes.
Checkpoint:
aws rds describe-db-instances --db-instance-identifier "$RDS_ID" \
  --region "$AWS_REGION" \
  --query 'DBInstances[0].[DBInstanceStatus,Endpoint.Address,PubliclyAccessible]' \
  --output text
Expect available <endpoint> False.
You cannot connect from your laptop, and that is the point. We prove connectivity from inside the cluster in Stage 5.
Stage 4 — Teaching the cluster to make load balancers
In plain words: hire the doorman. Until you do, asking for a front door does nothing at all.
Our Ingress file asks for ingressClassName: alb. Out of the box, nothing in an EKS cluster knows what that means. The AWS Load Balancer Controller is the piece that watches for Ingress objects and calls the AWS API to build a real load balancer.
It needs AWS permissions. It gets them through IRSA — IAM Roles for Service Accounts — which is the single most elegant idea in this whole deployment.
How IRSA works, plainly
Normally, giving software AWS permissions means giving it an access key, which you then have to store, rotate, and worry about leaking.
IRSA removes the key entirely:
- The cluster has an OIDC identity provider (we enabled it with
withOIDC: truein Stage 2). - Kubernetes gives each pod a short-lived, signed token proving “I am the service account
aws-load-balancer-controllerin namespacekube-system.” - An IAM role trusts that specific statement from that specific cluster.
- The AWS SDK inside the pod swaps the token for temporary credentials that expire in an hour.
No secret is ever stored anywhere. The same idea reappears in Stage 6 for GitHub Actions.
The policy
The policy is maintained upstream, so download the current one rather than copying a stale copy from a blog post:
curl -o /tmp/alb-iam-policy.json \
  https://raw.githubusercontent.com/kubernetes-sigs/aws-load-balancer-controller/v2.8.2/docs/install/iam_policy.json

aws iam create-policy \
  --policy-name AWSLoadBalancerControllerIAMPolicy \
  --policy-document file:///tmp/alb-iam-policy.json \
  --query 'Policy.Arn' --output text
If it already exists from another project, that errors with EntityAlreadyExists — harmless. Just fetch the existing ARN:
aws iam list-policies --scope Local \
  --query "Policies[?PolicyName=='AWSLoadBalancerControllerIAMPolicy'].Arn" \
  --output text
Bind it to a service account
One eksctl command creates the IAM role, writes the trust policy against the cluster’s OIDC provider, creates the Kubernetes ServiceAccount, and annotates it with the role ARN:
eksctl create iamserviceaccount \
  --cluster "$CLUSTER_NAME" \
  --region "$AWS_REGION" \
  --namespace kube-system \
  --name aws-load-balancer-controller \
  --role-name AmazonEKSLoadBalancerControllerRole \
  --attach-policy-arn "arn:aws:iam::${AWS_ACCOUNT_ID}:policy/AWSLoadBalancerControllerIAMPolicy" \
  --approve
Install the controller
helm repo add eks https://aws.github.io/eks-charts
helm repo update

helm install aws-load-balancer-controller eks/aws-load-balancer-controller \
  -n kube-system \
  --set clusterName="$CLUSTER_NAME" \
  --set serviceAccount.create=false \
  --set serviceAccount.name=aws-load-balancer-controller \
  --set region="$AWS_REGION" \
  --set vpcId="$(aws eks describe-cluster --name "$CLUSTER_NAME" \
      --region "$AWS_REGION" \
      --query 'cluster.resourcesVpcConfig.vpcId' --output text)"
serviceAccount.create=false matters enormously. eksctl already made the service account with the IAM annotation attached. If you let Helm create a second one, it overwrites the first, the annotation vanishes, and the controller fails with AccessDenied at the exact moment you try to create the load balancer in the next stage — a full stage away from the actual mistake.
Checkpoint:
kubectl -n kube-system rollout status deployment/aws-load-balancer-controller --timeout=120s
kubectl -n kube-system describe sa aws-load-balancer-controller | grep eks.amazonaws.com/role-arn
Two pods running, and that annotation present. If the annotation is missing, fix it now rather than debugging it later.
Stage 5 — The first deploy, by hand
In plain words: unpack the boxes onto the shelves yourself, once, so you know what “working” looks like before a robot does it for you.
The Secret
Non-secret settings live in a ConfigMap that is committed to git. The database password, host and application key live in a Secret that never is.
export RDS_ENDPOINT=$(aws rds describe-db-instances \
  --db-instance-identifier "$RDS_ID" \
  --region "$AWS_REGION" \
  --query 'DBInstances[0].Endpoint.Address' --output text)

kubectl apply -f k8s/namespace.yaml

kubectl -n "$K8S_NAMESPACE" create secret generic backend-secret \
  --from-literal=APP_KEY="base64:$(openssl rand -base64 32)" \
  --from-literal=DB_HOST="$RDS_ENDPOINT" \
  --from-literal=DB_USERNAME="$RDS_USER" \
  --from-literal=DB_PASSWORD="$RDS_PASSWORD" \
  --dry-run=client -o yaml | kubectl apply -f -
That --dry-run=client -o yaml | kubectl apply -f - pattern is worth stealing. kubectl create secret fails if the secret already exists; this version generates the YAML without contacting the cluster, then applies it — so it creates or updates, and is safe to re-run.
APP_KEY must stay stable. Laravel uses it to encrypt session data and any encrypted columns. Regenerating it invalidates all of that. Generate once, then leave it alone. (We lost ours by accident — see the errors section.)
Config and Redis
kubectl apply -f k8s/configmap.yaml
kubectl apply -f k8s/redis.yaml
kubectl -n "$K8S_NAMESPACE" rollout status deployment/redis --timeout=120s
Two decisions in the ConfigMap are worth calling out:
CACHE_STORE: "redis"
SESSION_DRIVER: "redis"

# Migrations run as a separate Job, never on pod start: with several replicas
# every pod would race to migrate the same database.
RUN_MIGRATIONS: "false"
WAIT_FOR_DB: "true"
And why Redis runs inside the cluster rather than on ElastiCache: the cache holds derived data that can be rebuilt from MySQL at any moment. Losing it on a restart costs nothing but a slightly slower next request. Moving to ElastiCache later means changing one line — REDIS_HOST in the ConfigMap — with no application change at all.
Check the images are really in ECR
This step exists because skipping it cost us twenty minutes.
export IMAGE_TAG=bootstrapfor repo in "$BACKEND_REPO" "$FRONTEND_REPO"; do
printf '%-20s %s\n' "$repo" \
"$(aws ecr describe-images --repository-name "$repo" --region "$AWS_REGION" \
--image-ids imageTag="$IMAGE_TAG" \
--query 'imageDetails[0].imageTags' --output text 2>/dev/null || echo MISSING)"
doneBoth lines must print your tag. MISSING means the push never happened — building and tagging an image locally does not upload it.
Migrations as a Job
envsubst < k8s/migrate-job.yaml | kubectl apply -f -
kubectl -n "$K8S_NAMESPACE" wait --for=condition=complete job/migrate-bootstrap --timeout=300s
kubectl -n "$K8S_NAMESPACE" logs job/migrate-bootstrap
A Job runs a container once until it succeeds, then stops. Migrations must not run when a pod starts, because with two replicas both pods would race to alter the same tables at the same time.
The Job name includes the image tag:
metadata:
  name: migrate-${IMAGE_TAG}
That is not decoration. A completed Job’s pod spec is immutable — you cannot re-apply the same name with a different image. Including the tag gives each deploy its own Job. To retry the same tag you must delete first:
kubectl -n "$K8S_NAMESPACE" delete job "migrate-${IMAGE_TAG}"
envsubst < k8s/migrate-job.yaml | kubectl apply -f -
This Job is also your first proof that pods can reach RDS. If it hangs, the problem is the security group or the subnets, not the application.
Deploy the app
envsubst < k8s/backend.yaml  | kubectl apply -f -
envsubst < k8s/frontend.yaml | kubectl apply -f -
kubectl apply -f k8s/ingress.yaml

kubectl -n "$K8S_NAMESPACE" rollout status deployment/backend  --timeout=300s
kubectl -n "$K8S_NAMESPACE" rollout status deployment/frontend --timeout=300s
envsubst replaces ${ECR_REGISTRY}, ${BACKEND_REPO} and ${IMAGE_TAG} in the manifests with real values. The files in git stay generic.
Reading the backend manifest
The backend Deployment contains several decisions worth explaining, because they are the difference between a demo and something that survives contact with reality.
Rolling updates that never drop to zero:
strategy:
  type: RollingUpdate
  rollingUpdate:
    maxSurge: 1
    maxUnavailable: 0
maxUnavailable: 0 means Kubernetes must add a new healthy pod before removing an old one. Deploys cause no downtime.
Spreading across machines:
topologySpreadConstraints:
  - maxSkew: 1
    topologyKey: kubernetes.io/hostname
    whenUnsatisfiable: ScheduleAnyway
    labelSelector:
      matchLabels: { app: backend }
Without this, both replicas could land on the same node, and losing that one machine takes the whole API down. ScheduleAnyway means “prefer to spread, but do not refuse to schedule if you cannot”.
Three different health probes, doing three different jobs:
readinessProbe:
  httpGet: { path: /api/health, port: http }
livenessProbe:
  httpGet: { path: /up, port: http }
startupProbe:
  httpGet: { path: /up, port: http }
  periodSeconds: 5
failureThreshold: 30- Readiness asks “can this pod serve traffic right now?” It hits
/api/health, which actually checks MySQL and Redis. A pod that cannot see its dependencies is quietly removed from the Service instead of serving errors. - Liveness asks “is this process broken beyond repair?” It only checks that PHP responds. This is deliberate: if liveness also checked the database, a brief RDS hiccup would restart every pod simultaneously and turn a small problem into an outage.
- Startup gives a slow-booting container up to 150 seconds to come up (30 failures × 5 seconds) before liveness starts counting against it.
A PodDisruptionBudget:
apiVersion: policy/v1
kind: PodDisruptionBudget
spec:
  minAvailable: 1
“Never voluntarily take the last one down.” This protects against node maintenance draining both replicas at once. It also causes a very confusing problem when you try to scale a cluster to zero — see the errors section.
Resource requests and limits:
resources:
  requests: { cpu: "100m", memory: "192Mi" }
  limits:   { cpu: "500m", memory: "512Mi" }
The request is what the scheduler reserves — it is how Kubernetes decides which node has room. The limit is the hard ceiling. 100m means 0.1 of a CPU core.
The Ingress
apiVersion: networking.k8s.io/v1
kind: Ingress
metadata:
  name: aws-app
  namespace: aws-app
  annotations:
    alb.ingress.kubernetes.io/scheme: internet-facing
    alb.ingress.kubernetes.io/target-type: ip
    alb.ingress.kubernetes.io/listen-ports: '[{"HTTP": 80}]'
    alb.ingress.kubernetes.io/healthcheck-path: /healthz
    alb.ingress.kubernetes.io/load-balancer-name: aws-app-alb
spec:
  ingressClassName: alb
  rules:
    - http:
        paths:
          - path: /
            pathType: Prefix
            backend:
              service:
                name: frontend
                port:
                  number: 80
Every path goes to the frontend Service. The backend has no route from the outside world at all — the only way to reach it is through the frontend’s nginx proxy. One load balancer, one bill, one public surface.
target-type: ip sends traffic straight to pod IP addresses rather than to node ports, which removes a hop and makes health checks accurate per-pod.
Note listen-ports lists HTTP 80 only. There is no HTTPS listener. This matters — we wasted time on it, see the errors section.
Get the URL
kubectl -n "$K8S_NAMESPACE" get ingress aws-appWait for the ADDRESS column to fill in — the ALB takes 2–4 minutes to become active. Then:
export APP_URL="http://$(kubectl -n "$K8S_NAMESPACE" get ingress aws-app \
  -o jsonpath='{.status.loadBalancer.ingress[0].hostname}')"
echo "$APP_URL"
Checkpoint:
curl -s "$APP_URL/api/health"{"status":"ok","services":{"database":"up","redis":"up"}}An early 503 is normal — the DNS name appears a minute or two before the load balancer’s health checks start passing. Retry rather than debugging it.
curl -s -X POST "$APP_URL/api/messages" -H 'Content-Type: application/json' \
  -d '{"username":"manu","message":"hello from EKS"}'

curl -s "$APP_URL/api/messages"
How load balancing actually works, hop by hop
In plain words: there is not one doorman. There are four separate places where something decides “which copy should handle this?” — and they use completely different mechanisms.
Follow a single click in order.
Hop 1 — DNS hands out several addresses
dig +short aws-app-alb-404476546.ap-southeast-2.elb.amazonaws.comThat returns more than one IP address, typically one per availability zone. The ALB is not a machine; it is a fleet of them, with at least one presence in each zone your subnets cover.
The browser picks one of the returned addresses — effectively the first layer of load balancing, and it happens before a single packet reaches AWS.
Two consequences people get bitten by:
- Never cache or hardcode these IPs. AWS changes them as it scales the ALB in and out. The name is the contract; the addresses are not.
- The TTL is 60 seconds, so a client that respects DNS re-checks often. One that does not — some JVM configurations, notoriously — can hold a dead IP for hours.
Hop 2 — The ALB picks a target
The ALB terminates the connection and decides which pod gets the request.
Our Ingress produced this: one listener on port 80, one rule sending everything (path: /, pathType: Prefix) to one target group, and that target group contains pod IP addresses.
Why pod IPs directly? This annotation:
alb.ingress.kubernetes.io/target-type: ipThere are two modes and the difference is substantial:
instance | ip (what we use) | |
|---|---|---|
| Targets registered | node NodePorts | pod IPs directly |
| Network hops | ALB → node → kube-proxy → pod | ALB → pod |
| Health checks measure | the node’s port | the actual pod |
| Works with Fargate | no | yes |
With instance mode the ALB cannot tell healthy pods from unhealthy ones — it only sees the node. With ip mode each pod is its own target, so one sick pod is removed while its neighbours keep serving. It also removes a hop.
The default algorithm is round robin. Request one goes to pod A, request two to pod B, three to A again. It does not consider how busy each pod is, which is fine when requests are uniform and poor when they are not — one slow endpoint can queue up behind an otherwise idle pod.
For uneven workloads, switch it:
alb.ingress.kubernetes.io/target-group-attributes: load_balancing.algorithm.type=least_outstanding_requestsThat sends each request to whichever target has the fewest in flight. For an API where some calls take 5ms and others 500ms, it is usually the better choice.
Cross-zone load balancing is always on for an ALB, and free. Every ALB node can send traffic to targets in any zone, so an imbalance in pod placement does not create an imbalance in traffic. (This is not true of Network Load Balancers, where cross-zone is off by default and billed when enabled.)
We do not enable sticky sessions, and that is a deliberate design decision rather than an omission. Stickiness would pin each user to one pod, which undermines even distribution and makes rolling deploys disruptive. We can skip it precisely because SESSION_DRIVER: "redis" makes every pod able to serve every user.
Hop 2b — How the ALB knows which pods exist
This is the part that feels like magic and is worth demystifying.
The AWS Load Balancer Controller watches the Kubernetes API for Endpoints — the live list of pod IPs backing a Service. When that list changes, it calls the AWS API to register or deregister targets.
The chain, end to end:
- The backend pod’s
readinessProbehits/api/health, which checks MySQL and Redis. - Three consecutive failures (
failureThreshold: 3,periodSeconds: 10) mark the pod not-ready. - Kubernetes removes that pod’s IP from the Service’s Endpoints.
- The controller sees the change and deregisters the target from the ALB.
- The ALB stops sending it traffic.
Meanwhile the ALB is running its own health check, independently:
alb.ingress.kubernetes.io/healthcheck-path: /healthz
alb.ingress.kubernetes.io/healthcheck-interval-seconds: "15"
alb.ingress.kubernetes.io/success-codes: "200"
Note the path is /healthz, answered by the frontend’s nginx directly:
location = /healthz {
    access_log off;
    add_header Content-Type text/plain;
    return 200 'ok';
}
Deliberately, that does not touch the backend. The ALB’s question is “is this nginx alive?” — not “is the entire system healthy?”. If the ALB health check hit an endpoint that depended on the database, an RDS blip would make the ALB deregister every target at once and take the site fully down, rather than degrading.
So there are two health systems with different jobs: Kubernetes readiness decides membership, and the ALB health check is a second opinion on reachability. Both must pass.
Watch it live:
aws elbv2 describe-target-health --region "$AWS_REGION" \
  --target-group-arn "$(aws elbv2 describe-target-groups --region "$AWS_REGION" \
      --query 'TargetGroups[?contains(TargetGroupName,`aws-app`)].TargetGroupArn' \
      --output text)"
You will see each pod IP with healthy, initial, or draining.
Hop 2c — Draining, and why deploys do not drop requests
When a pod goes away, the ALB does not cut its connections. The target enters draining for the deregistration delay — 300 seconds by default. Existing requests finish; no new ones arrive.
Combined with maxUnavailable: 0 in the Deployment, a rolling update looks like:
- New pod starts, passes its startup and readiness probes.
- Its IP is added to Endpoints, registered as a target, passes ALB health checks.
- Only now is an old pod terminated.
- The old target drains, finishing in-flight requests.
Nobody sees an error. For a lab, 300 seconds of draining is longer than necessary and makes deploys feel slow — 30 is plenty:
alb.ingress.kubernetes.io/target-group-attributes: deregistration_delay.timeout_seconds=30Hop 3 — nginx forwards /api to the backend Service
The request is now inside a frontend pod. nginx decides what to do with it:
location /api/ {
    proxy_pass ${BACKEND_URL}/api/;
}
BACKEND_URL was substituted at container start with http://backend.aws-app.svc.cluster.local:8000.
A real gotcha lives in this line. When proxy_pass contains a literal hostname with no nginx variable in it, nginx resolves that name once, at startup, and caches the result for the life of the process. It does not re-resolve.
We get away with it because a Service’s ClusterIP is stable for the entire life of the Service — pods come and go behind it, but the virtual IP never changes. If someone deleted and recreated the backend Service, it would get a new ClusterIP and every frontend pod would keep hammering the old, dead one until restarted.
If that risk matters to you, force runtime resolution by putting the host in a variable and giving nginx a resolver:
resolver kube-dns.kube-system.svc.cluster.local valid=10s;
set $backend_upstream "http://backend.aws-app.svc.cluster.local:8000";
proxy_pass $backend_upstream/api/;
Hop 4 — The Service picks a backend pod
This is the layer people assume is a load balancer and is not. There is no process in the middle. There is no proxy.
backend.aws-app.svc.cluster.local resolves — via CoreDNS — to the Service’s ClusterIP, a virtual address that belongs to no machine at all. Nothing listens on it.
What actually happens: kube-proxy runs on every node and programs iptables rules. When a packet is sent to the ClusterIP, the kernel rewrites the destination to one of the real pod IPs before the packet ever leaves the node.
The selection rule is worth being precise about, because it is widely misdescribed. With two pods, iptables uses:
-m statistic --mode random --probability 0.50 -j DNAT --to-destination <pod A>
-j DNAT --to-destination <pod B>
That is random, not round robin. Each connection independently gets a coin flip. Over thousands of requests it evens out; over ten it very well might go 7/3. If you are load testing with a small number of requests and see uneven distribution, this is why — nothing is broken.
Note also it balances per connection, not per request. nginx keeps connections alive to the backend, so many HTTP requests can ride the same TCP connection to the same pod. This is another reason small tests look lopsided.
Some clusters run kube-proxy in IPVS mode instead, which offers real round robin and least-connection algorithms. EKS defaults to iptables, which is what we have.
You can see the endpoints being balanced across:
kubectl -n aws-app get endpoints backendNAME ENDPOINTS AGE
backend 192.168.14.21:8000,192.168.52.8:8000 12mThose two IPs are the pods. That list is the input to everything above.
Hop 5 — Redis and MySQL are not load balanced at all
Worth stating plainly, because the symmetry breaks here.
Redis has a Service, but only one pod behind it. Every request goes to the same place. The Service exists for the stable name, not for balancing.
MySQL is not a Kubernetes object at all. The backend connects to the RDS endpoint, a single DNS name pointing at a single instance. With --no-multi-az there is no second instance to balance against.
If you moved to Multi-AZ RDS you would get a standby, which is for failover, not load sharing — it serves no reads. To actually spread database load you add read replicas, each with its own endpoint, and the application has to be taught to send reads to one and writes to the other. Laravel supports this natively with read/write connection config, but it is an application change, not an infrastructure toggle.
The whole picture, in order
| # | Where | Chooses between | Mechanism | Algorithm |
|---|---|---|---|---|
| 1 | Client DNS | ALB nodes per AZ | DNS A records, 60s TTL | client’s choice |
| 2 | ALB | frontend pods | target group of pod IPs | round robin (configurable) |
| 3 | nginx in frontend pod | nothing — one upstream | proxy_pass to ClusterIP | n/a |
| 4 | kube-proxy / iptables | backend pods | in-kernel DNAT | random per connection |
| 5 | backend pod | nothing | direct connections | n/a |
Four opportunities to distribute traffic, three different mechanisms, and only one of them is a load balancer in the product sense. Knowing which layer you are looking at is most of debugging “why is all the traffic hitting one pod?”
Where everything actually runs
In plain words: we rented two computers. Here is exactly what is sitting on each of them, and what happens if one catches fire.
Two t3.medium nodes: 2 vCPU and 4 GiB each. After Kubernetes and the operating system take their cut, roughly 1930m of CPU and ~3.2 GiB of memory are actually schedulable per node. (“1930m” is millicores — 1930m is 1.93 CPU cores.)
Here is what lands where:
        ┌──────────────── node A ────────────────┐   ┌──────────────── node B ────────────────┐
        │  backend    (100m / 192Mi requested)   │   │  backend    (100m / 192Mi)             │
        │  frontend   (25m  / 32Mi)              │   │  frontend   (25m  / 32Mi)              │
        │  redis      (50m  / 64Mi)              │   │                                        │
        │                                        │   │                                        │
        │  -- system --                          │   │  -- system --                          │
        │  aws-node, kube-proxy                  │   │  aws-node, kube-proxy                  │
        │  coredns, metrics-server               │   │  coredns                               │
        │  aws-load-balancer-controller          │   │  aws-load-balancer-controller          │
        └────────────────────────────────────────┘   └────────────────────────────────────────┘
Check yours:
kubectl -n aws-app get pods -o wideThe NODE column tells you the truth. Add -A to see the system pods too.
Why backend and frontend are one-per-node
Not luck — it is this, in both Deployments:
topologySpreadConstraints:
  - maxSkew: 1
    topologyKey: kubernetes.io/hostname
    whenUnsatisfiable: ScheduleAnyway
    labelSelector:
      matchLabels: { app: backend }
topologyKey: kubernetes.io/hostname means “count pods per node”. maxSkew: 1 means no node may hold more than one more than any other. With two replicas and two nodes, that forces one each.
whenUnsatisfiable: ScheduleAnyway makes it a strong preference rather than a hard rule. If node B were full, the pod would still schedule onto node A rather than sitting Pending forever. For a two-node lab that is the right trade; DoNotSchedule would be correct in a larger cluster where you would rather wait than lose the spread.
The payoff: losing one node loses one backend and one frontend. The Service routes around them, the ALB drops those targets within a couple of health checks, and the site stays up on the survivors.
Redis is on exactly one node, and that is deliberate
spec:
  replicas: 1
  strategy:
    type: Recreate
One replica. It lives on whichever node the scheduler picked, and if that node dies, the cache dies with it.
That sounds alarming until you remember what is in it. The cache holds data derived from MySQL — message lists that can be recomputed at any moment. Losing it costs one slow request while it warms back up.
strategy: Recreate rather than RollingUpdate is the same reasoning made explicit: during an update, kill the old pod first, then start the new one. Briefly there is no Redis at all. For a cache that is correct — two Redis pods would be worse than none, because they would hold different data and requests would bounce between them at random, producing inconsistent results with no error to point at.
It also means Redis is not highly available, and the app is written knowing that. /api/health reports Redis separately, and a cache miss falls through to MySQL rather than failing.
The moment you want real HA for the cache, you do not add replicas — you move to ElastiCache, which handles replication and failover properly. One line changes:
REDIS_HOST: "redis"becomes your ElastiCache endpoint. No application change.
One thing worth noticing about sessions
The ConfigMap sets SESSION_DRIVER: "redis". That is not incidental — it is what makes the backend stateless and therefore scalable.
If sessions were stored on local disk, a user’s second request could land on the other backend pod, find no session, and log them out. Putting sessions in Redis means any pod can serve any request. That is the precondition for every scaling decision below.
The cost is that a Redis restart logs everybody out. For this app, acceptable.
How autoscaling would work here
Let us be direct: nothing autoscales in this setup right now. Understanding why, and what each missing piece would do, is more useful than a config you paste without understanding.
There are three independent layers, and people routinely confuse them.
| Layer | Scales | Component | Installed? |
|---|---|---|---|
| Pods | replica count of a Deployment | HorizontalPodAutoscaler | No — but its prerequisite is |
| Nodes | number of EC2 machines | Cluster Autoscaler or Karpenter | No |
| Pod size | CPU/memory of a single pod | VerticalPodAutoscaler | No |
The trap in our node group
managedNodeGroups:
  - name: ng-default
    desiredCapacity: 2
    minSize: 2
    maxSize: 4
maxSize: 4 looks like autoscaling. It is not. It is a ceiling, nothing more — permission for something else to scale up to 4. With no Cluster Autoscaler installed, nothing ever changes desiredCapacity, and the cluster sits at exactly 2 nodes forever.
If you schedule more pods than fit, they go Pending and stay there:
kubectl -n aws-app get pods
NAME                       READY   STATUS    RESTARTS   AGE
backend-7d4f8b9c5-xk2p9    0/1     Pending   0          3m
kubectl -n aws-app describe pod backend-7d4f8b9c5-xk2p9
...
Warning FailedScheduling 0/2 nodes are available: 2 Insufficient cpu.That message is the whole story: Kubernetes will not invent machines.
Layer 1: scaling pods with an HPA
The good news is the prerequisite is already there. metrics-server runs in kube-system — we saw it earlier, when its PodDisruptionBudget blocked a node drain. Confirm:
kubectl top nodes
kubectl top pods -n aws-app
If those return numbers, an HPA will work today.
Here is one for the backend:
apiVersion: autoscaling/v2
kind: HorizontalPodAutoscaler
metadata:
  name: backend
  namespace: aws-app
spec:
  scaleTargetRef:
    apiVersion: apps/v1
    kind: Deployment
    name: backend
  minReplicas: 2
  maxReplicas: 8
  metrics:
    - type: Resource
      resource:
        name: cpu
        target:
          type: Utilization
          averageUtilization: 70
  behavior:
    scaleUp:
      stabilizationWindowSeconds: 60
    scaleDown:
      stabilizationWindowSeconds: 300
The single most misunderstood line is averageUtilization: 70. It is not 70% of the node’s CPU. It is 70% of the pod’s request.
Our backend requests 100m. So 70% means the HPA adds pods once average usage passes 70m per pod — even though the limit is 500m and the node has 1930m free. Set the request too low and you scale out constantly while each pod sits nearly idle. Set it too high and you never scale at all.
This is why the requests values in Stage 5 matter far more than they look. They are simultaneously the scheduler’s capacity math and the HPA’s denominator.
The asymmetric behavior block is worth copying: scale up quickly (60s) because being under-provisioned hurts users, but scale down slowly (300s) because flapping between 3 and 4 replicas every minute is worse than running one extra pod.
How far can we scale before running out of room?
Simple arithmetic, and worth doing before you set maxReplicas.
Two nodes give roughly 3860m schedulable CPU. Subtract what is already requested:
| Pods | CPU requested |
|---|---|
| backend × 2 | 200m |
| frontend × 2 | 50m |
| redis × 1 | 50m |
| system pods (coredns, aws-node, kube-proxy, metrics-server, ALB controller) | ~600m |
| Used | ~900m |
| Free | ~2960m |
At 100m requested per backend pod, that is room for roughly 29 more backend pods before the nodes are full on CPU.
So maxReplicas: 8 is comfortably safe on the current two nodes. Memory is not the constraint here either: 192Mi per backend pod against ~6.4 GiB total.
Run the numbers for your own values rather than trusting these — the point is the method, not the figures.
Layer 2: scaling nodes
Once the HPA wants more pods than fit, you need machines. Two options.
Cluster Autoscaler is the older one. It watches for Pending pods and increases the EC2 Auto Scaling Group’s desired capacity — up to that maxSize: 4 we set. It only understands the node groups you have already defined, so every new machine is another t3.medium whether or not that is the right shape.
Karpenter is the modern replacement and what I would use now. Instead of adjusting a fixed group, it looks at the actual pending pods and provisions whatever instance type fits best — including spot instances — then consolidates underused nodes back down. It is more setup and worth it beyond a lab.
Either way, understand the latency. An HPA adds a pod in seconds. Adding a node means launching an EC2 instance, joining the cluster, and pulling images: typically 60–120 seconds before that pod runs. Scaling out under a sudden traffic spike is not instant, which is why people over-provision slightly or use Karpenter with warm capacity.
Layer 3: the load balancer
The ALB scales itself. AWS handles it and you are billed by capacity units, so there is nothing to configure. Worth stating only because people go looking for a knob that does not exist.
What would break first
If you turned on an HPA today and drove real traffic at it, the order of failure would be:
- Backend pods scale out fine — up to about 29 on the current nodes.
- RDS becomes the bottleneck.
db.t4g.microhas 2 vCPU, 1 GiB RAM and amax_connectionsaround 60. Each PHP-FPM worker opens its own connection. Twenty backend pods will exhaust that long before the nodes run out of CPU. Symptoms areSQLSTATE[HY000] [1040] Too many connections, not anything a Kubernetes command will show you. - Redis stays a single pod, and every one of those backend pods talks to it. It is fast and it will cope for a long time, but it is a single point of failure the whole time.
The lesson generalises: autoscaling the stateless tier just moves the bottleneck to the stateful one. Scaling the application is the easy half.
A sensible order to add it
- An HPA on
backend— cheap, safe, immediately useful. - An HPA on
frontend— it serves static files, so it will rarely trigger. - Karpenter for nodes, once pods actually go
Pending. - A bigger RDS instance or RDS Proxy for connection pooling, before any of the above matters at real traffic.
- ElastiCache, when a cache restart becomes unacceptable rather than merely annoying.
Stage 6 — The robot: automated deploys with no stored keys
In plain words: teach the shop to restock itself whenever you write a new page — without giving the delivery company a key to the building.
The naive way to let GitHub deploy to AWS is to create an access key and paste it into GitHub Secrets. That key is long-lived, it works from anywhere on earth, and if it leaks you may not find out for months.
OIDC removes the key completely. Instead:
- GitHub mints a short-lived, cryptographically signed token for each workflow run. The token states facts: which repository, which branch, which workflow.
- AWS is configured to trust tokens signed by GitHub — but only when the facts match your repository.
- AWS hands back temporary credentials valid for one hour.
Nothing is stored. A stolen token is useless within the hour, and useless from any other repository even before that.
Register GitHub as an identity provider
Once per AWS account:
aws iam create-open-id-connect-provider \
  --url https://token.actions.githubusercontent.com \
  --client-id-list sts.amazonaws.com \
  --thumbprint-list 6938fd4d98bab03faadb97b34396831e3780aea1
EntityAlreadyExists means another project already created it. That is fine — it is account-wide. But check its audience list, because your --client-id-list is silently discarded when the provider already exists:
aws iam get-open-id-connect-provider \
  --open-id-connect-provider-arn \
  "arn:aws:iam::${AWS_ACCOUNT_ID}:oidc-provider/token.actions.githubusercontent.com"
ClientIDList must contain sts.amazonaws.com.
The role and its trust policy
{
  "Version": "2012-10-17",
  "Statement": [
    {
      "Effect": "Allow",
      "Principal": {
        "Federated": "arn:aws:iam::ACCOUNT_ID:oidc-provider/token.actions.githubusercontent.com"
      },
      "Action": "sts:AssumeRoleWithWebIdentity",
      "Condition": {
        "StringEquals": {
          "token.actions.githubusercontent.com:aud": "sts.amazonaws.com"
        },
        "StringLike": {
          "token.actions.githubusercontent.com:sub": [
            "repo:GITHUB_REPO:*",
            "repo:GITHUB_REPO_IDS:*"
          ]
        }
      }
    }
  ]
}
Read that Condition block carefully, because it is the entire security model:
audmust equalsts.amazonaws.com— the token was minted for AWS, not for some other service.submust match your repository — the token came from your repo.
Leaving sub as * would let any repository on GitHub assume your role. This is not theoretical; it is a well-known way people get compromised.
Note the two operators are different. aud uses StringEquals, an exact match. sub uses StringLike, which is the only operator where acts as a wildcard. Writing StringEquals with a in the value compares the literal asterisk and silently never matches.
Render and create:
sed -e "s|ACCOUNT_ID|${AWS_ACCOUNT_ID}|g" \
    -e "s|GITHUB_REPO_IDS|${GITHUB_REPO_IDS}|g" \
    -e "s|GITHUB_REPO|${GITHUB_REPO}|g" \
    deploy/iam/github-oidc-trust-policy.json.example > /tmp/trust-policy.json

grep -A3 sub /tmp/trust-policy.json
Substitute GITHUB_REPO_IDS before GITHUB_REPO — the shorter name is a prefix of the longer one, and sed would otherwise corrupt it.
aws iam create-role \
  --role-name "$GHA_ROLE_NAME" \
  --assume-role-policy-document file:///tmp/trust-policy.json \
  --query 'Role.Arn' --output text
Got it wrong already? Do not delete the role — replace the policy in place:
aws iam update-assume-role-policy \
  --role-name "$GHA_ROLE_NAME" \
  --policy-document file:///tmp/trust-policy.json

aws iam get-role --role-name "$GHA_ROLE_NAME" \
  --query 'Role.AssumeRolePolicyDocument'
The single most confusing thing in this entire deployment
GitHub does not send the subject claim you expect.
Every tutorial tells you the sub looks like this:
repo:owner/name:ref:refs/heads/mainThe actual token contained this:
repo:owner@45554842/name@1359158250:ref:refs/heads/mainGitHub mints immutable subject claims: the owner and repository names carry their numeric database IDs appended. It is a genuinely good design — the claim survives a rename, and nobody can hijack your trust policy by registering your old username after you change it.
But it means a trust policy written the standard way simply never matches. And the failure is maximally unhelpful, because AWS returns the same message for a missing role, a wrong audience, a wrong principal and a wrong subject:
Error: Could not assume role with OIDC: Not authorized to perform sts:AssumeRoleWithWebIdentityWorse: ${{ github.repository }} still prints the plain owner/name. So you can print the repository in your workflow, compare it against your trust policy, see them match perfectly, and still be wrong. We burned an entire debugging session eliminating correct configuration.
The only reliable move is to read the token itself. Add this step before configure-aws-credentials. It prints the claims, never the token:
- name: Decode the real OIDC claims
  run: |
    TOKEN=$(curl -sS \
      -H "Authorization: bearer $ACTIONS_ID_TOKEN_REQUEST_TOKEN" \
      "${ACTIONS_ID_TOKEN_REQUEST_URL}&audience=sts.amazonaws.com" \
      | jq -r '.value')
    echo "$TOKEN" | cut -d. -f2 | python3 -c "import sys,base64,json;d=sys.stdin.read().strip();d+='='*(-len(d)%4);print(json.dumps(json.loads(base64.urlsafe_b64decode(d)),indent=2))"
Which finally printed the truth:
{
  "sub": "repo:owner@45554842/name@1359158250:ref:refs/heads/main",
  "aud": "sts.amazonaws.com",
  "repository": "owner/name",
  "repository_owner": "owner",
  "ref": "refs/heads/main"
}
Take the owner@id/name@id portion, put it in deploy/env.sh as GITHUB_REPO_IDS, re-render the trust policy, and update the role. The policy above lists both forms, so the role keeps working whichever format GitHub sends — and both are exactly scoped to your repository, so neither weakens the trust boundary.
No push is needed after fixing a trust policy. IAM changes take effect immediately; just re-run the failed job.
Permissions for the role
Separate from who may assume the role is what the role may do:
sed "s|ACCOUNT_ID|${AWS_ACCOUNT_ID}|g" \
    deploy/iam/github-actions-policy.json > /tmp/gha-policy.json

aws iam put-role-policy \
  --role-name "$GHA_ROLE_NAME" \
  --policy-name GitHubActionsDeployPolicy \
  --policy-document file:///tmp/gha-policy.json

export GHA_ROLE_ARN="arn:aws:iam::${AWS_ACCOUNT_ID}:role/${GHA_ROLE_NAME}"
Push to ECR, read cluster info. Nothing more.
Let the role into the cluster — a separate permission system
This is the step people forget, and the reason is conceptual: IAM permission to describe a cluster is not permission to deploy into it. Kubernetes has its own authorization, and EKS bridges the two with access entries.
aws eks create-access-entry \
  --cluster-name "$CLUSTER_NAME" --region "$AWS_REGION" \
  --principal-arn "$GHA_ROLE_ARN" \
  --type STANDARD

aws eks associate-access-policy \
  --cluster-name "$CLUSTER_NAME" --region "$AWS_REGION" \
  --principal-arn "$GHA_ROLE_ARN" \
  --access-scope '{"type":"namespace","namespaces":["aws-app"]}' \
  --policy-arn arn:aws:eks::aws:cluster-access-policy/AmazonEKSEditPolicy
The access scope limits the role to the aws-app namespace. A compromised CI token cannot touch kube-system.
Watch that policy ARN. The account segment is the literal string aws (arn:aws:eks::aws:...), not empty. We had arn:aws:eks:::cluster-access-policy/... with three colons, which returns:
ResourceNotFoundException: The specified policyArn could not be found.Verify:
aws eks list-associated-access-policies \
  --cluster-name "$CLUSTER_NAME" --region "$AWS_REGION" \
  --principal-arn "$GHA_ROLE_ARN"
Configure the repository
In GitHub → your repository → Settings → Secrets and variables → Actions, on the Variables tab. The direct URL is:
https://github.com/<owner>/<repo>/settings/variables/actionsNote your repository’s settings, not your account settings. This trips people up badly — the account-level Credentials page looks similar, sits at a nearly identical URL, and has none of these options. We spent a while looking at the wrong page entirely, concluding the feature was missing.
Repository variables:
| Name | Value |
|---|---|
AWS_ROLE_ARN | the role ARN from above |
AWS_REGION | your region |
CLUSTER_NAME | aws-app-cluster |
K8S_NAMESPACE | aws-app |
FRONTEND_REPO | aws-app-frontend |
BACKEND_REPO | aws-app-backend |
When you are done it looks like this:

Every one of these is read by the workflow — five of them in the top-level env: block, and AWS_ROLE_ARN by both configure-aws-credentials steps. A missing or misspelled variable resolves to an empty string rather than an error, which produces a failure much further along that looks like something else entirely.
A role ARN is an identifier, not a credential — your security comes from the trust policy, not from hiding the ARN. Storing it as a variable rather than a secret means it appears in logs instead of being masked as *, which makes debugging enormously easier. We started with it as a secret and could not tell whether it had a typo, a trailing space, or was set at all.
The pipeline
on:
  push:
    branches: [main]
    paths:
      - 'www/'
      - 'k8s/'
      - '.github/workflows/deploy.yml'
  workflow_dispatch:

permissions:
  id-token: write
  contents: read

concurrency:
  group: deploy-eks
  cancel-in-progress: false
id-token: writeis mandatory. Without it there is no OIDC token to mint, and the whole scheme fails. If any job declares its ownpermissions:block, it replaces this one — a classic way to lose it accidentally.pathsmeans documentation-only commits do not trigger a deploy. It also means an empty commit will not trigger one, which is worth knowing when you are trying to force a run. Useworkflow_dispatchfrom the Actions tab instead.concurrencywithcancel-in-progress: falsequeues deploys rather than running two at once against the same cluster.
Two jobs. The first builds:
- name: Derive image tag
  id: meta
  run: echo "tag=${GITHUB_SHA::12}" >> "$GITHUB_OUTPUT"
Tagging by commit SHA rather than latest means every deploy is uniquely addressable and rolling back is just pointing at an older tag. latest is also pushed, but nothing deploys from it.
- uses: aws-actions/configure-aws-credentials@v4
  with:
    role-to-assume: ${{ vars.AWS_ROLE_ARN }}
    aws-region: ${{ env.AWS_REGION }}
    role-skip-session-tagging: true

- name: Log in to Amazon ECR
  id: login-ecr
  uses: aws-actions/amazon-ecr-login@v2

- name: Build and push backend
  uses: docker/build-push-action@v6
  with:
    context: ./www/backend
    push: true
    platforms: linux/amd64
    tags: |
      ${{ steps.login-ecr.outputs.registry }}/${{ env.BACKEND_REPO }}:${{ steps.meta.outputs.tag }}
      ${{ steps.login-ecr.outputs.registry }}/${{ env.BACKEND_REPO }}:latest
    cache-from: type=gha,scope=backend
    cache-to: type=gha,scope=backend,mode=max
platforms: linux/amd64 is the same arm64/x86_64 issue from Stage 1, solved permanently. cache-from/cache-to reuse Docker layers between runs, which takes the backend build from minutes to seconds when only application code changed.
The second job deploys, and mirrors Stage 5 exactly: kubeconfig, base manifests, migration Job, rolling update, smoke test.
The deploy log, annotated
Here is what a successful run actually printed. This is the real thing.
Assuming the role. No stored key was involved:
Assuming role with OIDC
Authenticated as assumedRoleId AROAXYKJTEOELLYDBHFOJ:GitHubActions
Getting cluster access:
Added new context arn:aws:eks:ap-southeast-2:111122223333:cluster/aws-app-cluster
to /home/runner/.kube/config
Base manifests. Note namespace/aws-app unchanged — kubectl apply is declarative, so re-applying something identical is a no-op:
namespace/aws-app unchanged
configmap/backend-config created
deployment.apps/redis created
service/redis created
Waiting for deployment "redis" rollout to finish: 0 of 1 updated replicas are available...
deployment "redis" successfully rolled out
Migrations. The database already had its tables from a previous deploy, so there was nothing to do — but the Job still ran, and its success is the proof that a pod could reach RDS:
job.batch/migrate-8ca0f7fc2268 created

   INFO  Nothing to migrate.

migrations complete
migrations applied
The application:
deployment.apps/backend created
service/backend created
poddisruptionbudget.policy/backend created
deployment.apps/frontend created
service/frontend created
poddisruptionbudget.policy/frontend created
ingress.networking.k8s.io/aws-app created
The rolling update. Watch the ordering — a new pod becomes available before the old one is removed, which is maxUnavailable: 0 doing its job:
Waiting for deployment "backend" rollout to finish: 1 of 2 updated replicas are available...
deployment "backend" successfully rolled out
deployment "frontend" successfully rolled out
The smoke test, and a lovely piece of real-world behaviour:
ingress host: aws-app-alb-404476546.ap-southeast-2.elb.amazonaws.com
curl: (6) Could not resolve host: aws-app-alb-404476546.ap-southeast-2.elb.amazonaws.com
curl: (6) Could not resolve host: aws-app-alb-404476546.ap-southeast-2.elb.amazonaws.com
... twelve times ...
{"status":"ok","services":{"database":"up","redis":"up"}}
smoke test passed
Kubernetes knew the hostname before DNS did. The ALB controller creates the load balancer and writes its name into the Ingress status immediately, but that name takes a couple of minutes to propagate through the world’s DNS servers. Twelve failures, then success.
This is exactly why the smoke test retries in a loop instead of checking once. A single check would have failed a perfectly good deployment.
for i in $(seq 1 30); do
  if curl -fsS --max-time 5 "http://${HOST}/api/health" ; then
    echo; echo "smoke test passed"; exit 0
  fi
  sleep 10
done
echo "::error::ALB never returned a healthy /api/health"
exit 1
Every error we hit, and what it actually meant
This is the most useful section in the post. Every one of these cost real time, and none of the error messages pointed at the real cause.
ecr:CreateRepository AccessDenied
AccessDeniedException ... not authorized to perform: ecr:CreateRepositoryCause: the IAM user had EC2, VPC, CloudFormation and IAM permissions, but nobody had thought about ECR.
Lesson: this deployment touches nine different AWS services. Sort permissions out completely in Stage 0 rather than discovering them one denial at a time.
RDS: “Input can’t contain control characters”
aws rds create-db-subnet-group --subnet-ids $PRIVATE_SUBNETS ...
InvalidParameterValue: Input can't contain control characters.
Cause: pure shell behaviour, nothing to do with AWS. --output text separates values with a tab. In bash, an unquoted variable containing a tab gets split into separate words. zsh does not do this. So zsh passed one single argument containing a literal tab character — and that tab is the “control character” RDS is complaining about.
Fix: collect into an array and quote the expansion:
PRIVATE_SUBNETS=($(aws ec2 describe-subnets ... --output text))
aws rds create-db-subnet-group --subnet-ids "${PRIVATE_SUBNETS[@]}" ...
That form works correctly in both shells.
zsh: export: not an identifier: 1
export IMAGE_TAG=bootstrap # the tag you pushed in Stage 1Cause: macOS zsh has interactive_comments off, so # is not a comment on the command line. The words after it became arguments.
Related variants from the same root cause: zsh: command not found: # and cat: #: No such file or directory.
Fix: setopt interactive_comments, and write documentation with comments on their own line above the command rather than trailing it.
Pods stuck in ImagePullBackOff, reporting NotFound
Failed to pull image "111122223333.dkr.ecr.ap-southeast-2.amazonaws.com/aws-app-backend:bootstrap":
not found
Cause: the images were built and tagged locally, but never pushed. docker build -t creates a local name. It does not upload anything.
Why it was confusing: NotFound reads like a permissions problem. It is not — the registry genuinely has nothing under that tag. And the failure is slow: the pod sits in ImagePullBackOff until a 300-second timeout expires.
Fix: push, then delete and re-create the Job — a completed Job’s pod spec is immutable, so re-applying the same name changes nothing at all.
The trust policy that would not update
We fixed GITHUB_REPO in deploy/env.sh, regenerated the trust policy, applied it — and the old wrong value came back. Twice.
Cause: editing a file that has been sourced does not change the variables already loaded in the running shell.
Fix: source deploy/env.sh again, and echo "$GITHUB_REPO" to confirm before regenerating anything. This is obvious in hindsight and cost two full cycles.
zsh: no such file or directory: nodegroup-name
Cause: a documentation placeholder written as <nodegroup-name> was pasted literally, and zsh interpreted < as an input redirection.
Lesson: in copy-pasteable instructions, avoid angle brackets for placeholders. Use a variable, or say “replace THIS_WORD”.
A long command that arrived broken
export RDS_ENDPOINT=$(aws rds describe-db-instances --db-instance-identifier "$RDS_ID" --region "$AWS_REGION" --query
  'DBInstances[0].Endpoint.Address' --output text)

aws: [ERROR]: argument --query: expected one argument
zsh: command not found: DBInstances[0].Endpoint.Address
Cause: the command was one very long line. Copying it wrapped it, and the wrap inserted a newline with no continuation backslash — so the shell ran two fragments as two separate commands.
Fix: always break long commands across lines with trailing backslashes, so every physical line is short enough that a wrap cannot corrupt it.
The OIDC failure that survived three wrong theories
Error: Could not assume role with OIDC: Not authorized to perform sts:AssumeRoleWithWebIdentityWe checked, and each time found correct configuration:
- The trust policy — correct principal,
StringEqualsonaud,StringLikeonsub, right repository. - The OIDC provider — right URL,
sts.amazonaws.comin the audience list. - The role ARN — no typo, no trailing whitespace.
id-token: write— present, not overridden by any job.- No permissions boundary on the role.
First wrong theory: the debug log said “7 role session tags are being used”, and session tags require sts:TagSession in the trust policy. Plausible, consistent with the error, and completely wrong — adding role-skip-session-tagging: true changed nothing.
The real cause: GitHub’s immutable subject claim, described above. The lesson generalises well beyond this one bug:
When an OIDC assume-role fails and every piece of configuration inspects as correct, stop theorising and decode the token. AWS returns an identical “Not authorized” message for a missing role, a wrong audience, a wrong principal and a wrong subject — the error text cannot narrow it down, so stop trying to reason from it.
Nodes that would not terminate
Scaling the node group to zero left both machines running for fifteen minutes, with pods stuck Pending and nodes showing Ready,SchedulingDisabled.
Cause: PodDisruptionBudgets. coredns, metrics-server and the load balancer controller each require a minimum number of available replicas. With every node cordoned, that minimum can never be satisfied, so the drain waits forever.
Fix: managed node groups force termination after about 15 minutes anyway. To move faster, remove the blocking budgets:
kubectl -n kube-system delete pdb --allThe mistake that actually lost data
To clear the drain faster, we deleted the whole namespace:
kubectl delete namespace aws-appThat deleted the Secret, and with it the APP_KEY. Stage 5 creates that Secret imperatively with kubectl create secret, and k8s/secret.yaml is gitignored — so there was no copy anywhere on disk. It was simply gone.
The damage here was small: messages are stored as plain rows in MySQL, and sessions lived in the Redis pod that was being deleted anyway. A new APP_KEY cost nothing. In a real system it would be a serious incident — every encrypted column becomes unreadable.
Lessons:
- Never delete a namespace to speed up an unrelated operation.
- Anything created imperatively has no backup. Either commit an encrypted version, or move to AWS Secrets Manager with the Secrets Store CSI driver.
The load balancer that timed out
https://aws-app-alb-404476546.ap-southeast-2.elb.amazonaws.com/Timeout. Nothing wrong with the cluster.
Cause: https. The Ingress declares listen-ports: '[{"HTTP": 80}]' and nothing else. There is no listener on 443, and the ALB security group does not open it — so packets are dropped rather than refused, which produces a hang rather than a clean “connection refused”.
Fix: use http://. Browsers increasingly force HTTPS, so verify with curl first, where nothing rewrites your URL.
For real HTTPS you need an ACM certificate and a domain you control, then:
alb.ingress.kubernetes.io/listen-ports: '[{"HTTP": 80}, {"HTTPS": 443}]'
alb.ingress.kubernetes.io/certificate-arn: arn:aws:acm:REGION:ACCOUNT:certificate/ID
alb.ingress.kubernetes.io/ssl-redirect: "443"
The $8.17 surprise
Covered in Stage 2, but it belongs in this list. An unsupported Kubernetes version silently sextupled the control plane cost. Nothing in kubectl or the EKS console indicated it. The only signal was the invoice.
Verifying it properly
source deploy/env.sh
export APP_URL="http://$(kubectl -n aws-app get ingress aws-app \
  -o jsonpath='{.status.loadBalancer.ingress[0].hostname}')"

curl -s "$APP_URL/api/health"

curl -s -X POST "$APP_URL/api/messages" -H 'Content-Type: application/json' \
  -d '{"username":"manu","message":"deployed via GitHub Actions"}'

curl -s "$APP_URL/api/messages"
curl -s "$APP_URL/api/cache"

curl -s -X DELETE "$APP_URL/api/cache"
curl -s "$APP_URL/api/messages"
That last pair is the interesting demonstration: clear the cache, and the rows still come back — from MySQL, more slowly, with the badge in the UI changing to say so.
Prove the data really is in RDS, from inside the cluster:
kubectl -n aws-app exec deploy/backend -- \
  php artisan tinker --execute='echo App\Models\Message::count();'
And look at Redis directly:
kubectl -n aws-app exec deploy/redis -- redis-cli KEYS 'user:*'Running it day to day
kubectl -n aws-app logs -l app=backend --tail=100 -f

kubectl -n aws-app scale deployment/backend --replicas=3

kubectl -n aws-app rollout restart deployment/backend

kubectl -n aws-app rollout undo deployment/backend

kubectl -n aws-app exec -it deploy/backend -- sh
One non-obvious thing: changing k8s/configmap.yaml and applying it does not restart the pods. Environment variables are injected at container start. Apply, then rollout restart.
What it costs, and what you can switch off
| Resource | Monthly |
|---|---|
| EKS control plane (standard support) | $73 |
| 2 × t3.medium nodes | $60 |
| NAT gateway | $33 |
| ALB | $16 |
| RDS db.t4g.micro + 20GB | $15 |
| ECR storage | <$1 |
| Total | ≈ $197/month |
About $0.27/hour. A weekend costs roughly $13.
Pausing overnight
Two costs cannot be paused. The control plane (~$2.40/day, or ~$14.40/day if you are on an extended-support version) and the NAT gateway (~$1.40/day) live as long as the cluster does. Everything else can go:
kubectl delete -f k8s/ingress.yaml --ignore-not-found

eksctl scale nodegroup --cluster "$CLUSTER_NAME" --region "$AWS_REGION" \
  --name ng-default --nodes 0 --nodes-min 0

aws rds stop-db-instance --db-instance-identifier "$RDS_ID" --region "$AWS_REGION"
That saves about $3.60/day out of roughly $5. Which is the honest conclusion: for a single night, pausing is barely worth the effort and the risk of breaking something. If you are stopping for longer than a couple of days, tear it down properly instead.
Two warnings:
- RDS restarts itself after 7 days stopped. A long pause becomes a surprise bill.
- Do not delete the namespace to speed up the drain. See above.
Resuming
aws rds start-db-instance --db-instance-identifier "$RDS_ID" --region "$AWS_REGION"

eksctl scale nodegroup --cluster "$CLUSTER_NAME" --region "$AWS_REGION" \
  --name ng-default --nodes 2 --nodes-min 2

aws rds wait db-instance-available --db-instance-identifier "$RDS_ID" --region "$AWS_REGION"

kubectl apply -f k8s/ingress.yaml
The ALB comes back with a new hostname — it is a new load balancer. Re-fetch it rather than reusing the old one.
Removing everything
Deleting the cluster is not the same as deleting everything. A surprising amount survives eksctl delete cluster — IAM roles, IAM policies, CloudWatch log groups, an OIDC provider, ECR images — and some of it keeps costing money.
Work through this in order and you will be left with nothing.
Order matters
Delete the cluster first and you orphan the load balancer. Its leftover network interfaces then block the VPC from ever being deleted, and you finish the job by hand in the console, hunting ENIs. Always: Kubernetes objects, then the database, then the cluster.
1. Kubernetes objects, which removes the load balancer
source deploy/env.sh

kubectl delete -f k8s/ingress.yaml --ignore-not-found
kubectl delete namespace aws-app --ignore-not-found
The ALB controller notices the Ingress disappear and deletes the real load balancer. That takes up to a minute. Wait for it — this is the step that blocks everything downstream:
aws elbv2 describe-load-balancers --region "$AWS_REGION" \
  --query "LoadBalancers[?LoadBalancerName=='aws-app-alb'].LoadBalancerArn" \
  --output text
Repeat until it prints nothing.
2. The database
aws rds delete-db-instance --db-instance-identifier "$RDS_ID" \
  --skip-final-snapshot --delete-automated-backups --region "$AWS_REGION"

aws rds wait db-instance-deleted --db-instance-identifier "$RDS_ID" --region "$AWS_REGION"
Drop --skip-final-snapshot if you want a backup — but then remember the snapshot itself costs storage until you delete it too.
aws rds delete-db-subnet-group --db-subnet-group-name aws-app-db-subnets --region "$AWS_REGION"The security group we made for RDS lives in the cluster’s VPC and would block the VPC deletion:
aws ec2 delete-security-group --group-id "$RDS_SG" --region "$AWS_REGION"Lost $RDS_SG from your shell? Look it up by name:
aws ec2 describe-security-groups --region "$AWS_REGION" \
  --filters "Name=group-name,Values=aws-app-rds-sg" \
  --query 'SecurityGroups[0].GroupId' --output text
3. The cluster, its VPC, NAT gateway and nodes
eksctl delete cluster --name "$CLUSTER_NAME" --region "$AWS_REGION" --waitThis takes 10–15 minutes. It removes the control plane, both nodes, their EBS volumes, the VPC, the subnets, the NAT gateway, the Elastic IP attached to it, and the CloudFormation stacks eksctl created — including the IRSA role for the load balancer controller.
If it fails, it is almost always a leftover ENI from the ALB. Go back to step 1.
4. The registry
aws ecr delete-repository --repository-name "$FRONTEND_REPO" --force --region "$AWS_REGION"
aws ecr delete-repository --repository-name "$BACKEND_REPO"  --force --region "$AWS_REGION"
--force is required because the repositories still contain images.
5. The IAM leftovers
None of this is deleted by anything above, and it is easy to forget because it is free — but stale roles that can be assumed from the internet are exactly the kind of thing you do not want lying around.
The GitHub Actions role has an inline policy, which must go first:
aws iam delete-role-policy \
  --role-name "$GHA_ROLE_NAME" \
  --policy-name GitHubActionsDeployPolicy

aws iam delete-role --role-name "$GHA_ROLE_NAME"
The load balancer controller policy — only if eksctl did not already take it:
aws iam delete-policy \
  --policy-arn "arn:aws:iam::${AWS_ACCOUNT_ID}:policy/AWSLoadBalancerControllerIAMPolicy"
If that errors with DeleteConflict, something is still attached to it. Find out what:
aws iam list-entities-for-policy \
  --policy-arn "arn:aws:iam::${AWS_ACCOUNT_ID}:policy/AWSLoadBalancerControllerIAMPolicy"
Check for any IRSA role eksctl left behind:
aws iam list-roles \
  --query "Roles[?contains(RoleName, 'AmazonEKSLoadBalancerControllerRole')].RoleName" \
  --output text
6. The GitHub OIDC provider — think before deleting
aws iam list-open-id-connect-providersThis one is account-wide. If any other repository or project in this AWS account authenticates through GitHub Actions, deleting it breaks them immediately. Delete it only if this project was the sole user:
aws iam delete-open-id-connect-provider \
  --open-id-connect-provider-arn \
  "arn:aws:iam::${AWS_ACCOUNT_ID}:oidc-provider/token.actions.githubusercontent.com"
Leaving it costs nothing. When in doubt, leave it.
7. CloudWatch logs — the one that quietly keeps billing
Our cluster config enabled control plane logging:
cloudWatch:
  clusterLogging:
    enableTypes: ["api", "audit", "authenticator"]
Those log groups survive the cluster and keep charging for storage indefinitely. This is the most commonly missed item on the whole list:
aws logs describe-log-groups --region "$AWS_REGION" \
  --log-group-name-prefix "/aws/eks/${CLUSTER_NAME}" \
  --query 'logGroups[].logGroupName' --output text
aws logs delete-log-group --region "$AWS_REGION" \
--log-group-name "/aws/eks/${CLUSTER_NAME}/cluster"Worth a broader sweep for container logs too:
aws logs describe-log-groups --region "$AWS_REGION" \
--query 'logGroups[].[logGroupName,storedBytes]' --output table8. Take back the lab permissions
If you attached AdministratorAccess in Stage 0, remove it:
aws iam detach-user-policy \
--user-name <your-iam-user> \
--policy-arn arn:aws:iam::aws:policy/AdministratorAccessAnd if you used the narrower route, remove the inline policy too:
aws iam delete-user-policy --user-name <your-iam-user> --policy-name EksLabClusterAdminConsider deactivating the access key while you are there:
aws iam list-access-keys --user-name <your-iam-user>9. The GitHub side
Nothing here costs money, but the variables point at AWS resources that no longer exist, and a stale role ARN in a public repository is noise at best.
In Settings → Secrets and variables → Actions, delete AWS_ROLE_ARN, AWS_REGION, CLUSTER_NAME, K8S_NAMESPACE, FRONTEND_REPO, BACKEND_REPO.
If you left the temporary OIDC debug steps in the workflow, remove them now. They print token claims, which is fine while debugging and untidy forever.
10. Local cleanup
kubectl config delete-context "arn:aws:eks:${AWS_REGION}:${AWS_ACCOUNT_ID}:cluster/${CLUSTER_NAME}"
kubectl config delete-cluster "arn:aws:eks:${AWS_REGION}:${AWS_ACCOUNT_ID}:cluster/${CLUSTER_NAME}"
kubectl config delete-user "arn:aws:eks:${AWS_REGION}:${AWS_ACCOUNT_ID}:cluster/${CLUSTER_NAME}"
kubectl delete -f k8s/ingress.yaml --ignore-not-found
kubectl delete namespace aws-app --ignore-not-found
aws rds delete-db-instance --db-instance-identifier "$RDS_ID" \
--skip-final-snapshot --delete-automated-backups --region "$AWS_REGION"
aws rds wait db-instance-deleted --db-instance-identifier "$RDS_ID" --region "$AWS_REGION"
aws rds delete-db-subnet-group --db-subnet-group-name aws-app-db-subnets --region "$AWS_REGION"
eksctl delete cluster --name "$CLUSTER_NAME" --region "$AWS_REGION" --wait
aws ecr delete-repository --repository-name "$FRONTEND_REPO" --force --region "$AWS_REGION"
aws ecr delete-repository --repository-name "$BACKEND_REPO" --force --region "$AWS_REGION"
aws ec2 delete-security-group --group-id "$RDS_SG" --region "$AWS_REGION"
aws logs delete-log-group --region "$AWS_REGION" \
  --log-group-name "/aws/eks/${CLUSTER_NAME}/cluster"
aws iam delete-role-policy --role-name "$GHA_ROLE_NAME" --policy-name GitHubActionsDeployPolicy
aws iam delete-role --role-name "$GHA_ROLE_NAME"
CTX="arn:aws:eks:${AWS_REGION}:${AWS_ACCOUNT_ID}:cluster/${CLUSTER_NAME}"
kubectl config delete-context "$CTX"
kubectl config delete-cluster "$CTX"
kubectl config delete-user "$CTX"deploy/env.sh holds your database password. If you are done with the project, delete it rather than leaving it on disk.
11. Prove it is all gone
aws eks list-clusters --region "$AWS_REGION"

aws rds describe-db-instances --region "$AWS_REGION" \
  --query 'DBInstances[].DBInstanceIdentifier'

aws ec2 describe-nat-gateways --region "$AWS_REGION" \
  --filter "Name=state,Values=available" --query 'NatGateways[].NatGatewayId'

aws elbv2 describe-load-balancers --region "$AWS_REGION" \
  --query 'LoadBalancers[].LoadBalancerName'

aws ecr describe-repositories --region "$AWS_REGION" \
  --query 'repositories[].repositoryName'

aws ec2 describe-addresses --region "$AWS_REGION" \
  --query 'Addresses[].PublicIp'

aws ec2 describe-volumes --region "$AWS_REGION" \
  --filters "Name=status,Values=available" --query 'Volumes[].VolumeId'
Every one of those should come back empty. The last two matter more than people expect: an unattached Elastic IP is billed because it is unattached, and orphaned EBS volumes bill for their full provisioned size forever.
Then check the console the next day. Billing → Cost Explorer, grouped by service, filtered to your region. Yesterday should show a tail of charges and today should be flat. That is also where an unexpected line — like extended support — becomes visible in a way no CLI command will tell you.
Set a billing alarm before your next experiment:
aws budgets create-budget --account-id "$AWS_ACCOUNT_ID" \
  --budget '{"BudgetName":"lab-monthly","BudgetLimit":{"Amount":"20","Unit":"USD"},"TimeUnit":"MONTHLY","BudgetType":"COST"}'
What we would do differently
- Check the Kubernetes version support status before creating the cluster. One command, and it was the single most expensive mistake here.
- Decode the OIDC token first, rather than inspecting configuration that looks correct. Ten minutes of work would have replaced a whole session of elimination.
- Store the role ARN as a variable, not a secret. Masking a non-credential only makes debugging harder.
- Never create a Secret imperatively without a recovery path.
- Write every pasteable command with continuation backslashes.
Where to go next
- HTTPS — request an ACM certificate and uncomment the three Ingress annotations.
- ElastiCache — replace the Redis Deployment; only
REDIS_HOSTchanges. - Autoscaling — a HorizontalPodAutoscaler on the backend, plus Karpenter or Cluster Autoscaler for the nodes.
- Secrets Manager — swap the Kubernetes Secret for the Secrets Store CSI driver, which fixes the “imperative secret with no backup” problem properly.
- Multi-AZ RDS —
--multi-azfor automatic failover, at roughly double the database cost.
The short version
Seven ideas, in order: build a box, store the box, rent computers to run boxes on, give them a private network with a locked database in it, hire a doorman to let visitors in, deploy by hand once so you understand it, then let a robot do it — using a signed token instead of a stored key.
Everything else is detail. Very important detail, but detail.
Be the first to comment